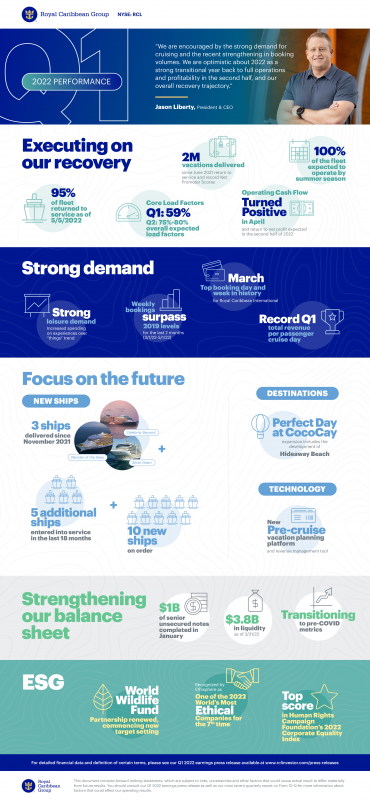
MIAMI – May 5, 2022 – Royal Caribbean Group (NYSE: RCL) today reported first quarter 2022 net loss of $(1.2) billion and loss per share of $(4.58). The Group continues to make strides in its healthy return to operations in a strong demand environment. Load factors continue to improve sequentially with total revenue per Passenger Cruise Day up versus record 2019 levels. Operating cash flow significantly improved throughout the first quarter and approached breakeven in March.
“It is gratifying to see our ships and crew returning to our mission of delivering the best vacation experiences in a safe and responsible way,” said Jason Liberty, president and chief executive officer of the Royal Caribbean Group. “Despite the impact of Omicron earlier in the year and the horrific conflict in Ukraine, we are encouraged by the strong demand for cruising and the steady acceleration in booking volumes,” Liberty added. “Since the beginning of March, booking volumes have exceeded the record levels achieved in 2019 and we are optimistic that 2022 will be a strong transitional year as we return to full operations and profitability in the second half of the year.”
Business Highlights
First Quarter 2022
The Company reported Net Loss for the first quarter of 2022 of $(1.2) billion or $(4.58) per share compared to Net Loss of $(1.1) billion or $(4.66) per share in the prior year. The Company also reported Adjusted Net Loss of $(1.2) billion or $(4.57) per share for the first quarter of 2022 compared to Adjusted Net Loss of $(1.1) billion or $(4.44) per share in the prior year. The Net Loss and Adjusted Net Loss for the quarter are primarily the result of the continued impact of the COVID-19 pandemic on the business.
The Group made significant progress in its recovery trajectory in the first quarter mainly due to continued strong demand for cruising and nimble execution in a challenging operating environment. During the first quarter, four additional ships resumed operations. The company continues to thoughtfully ramp up the fleet and load factors while emphasizing industry-leading health and safety standards, world-class guest experiences and financial prudence.
Ships that operated the Group's core itineraries in the first quarter achieved a load factor of 59%. Core itineraries exclude sailings during the early ramp-up period of up to four weeks. First quarter load factor was 57% with month-over-month sequential improvements. March load factors were 68%. Total revenue per Passenger Cruise Day in the first quarter was up 4% versus record 2019 levels driven by continued strong onboard revenue performance. Cash flow from ships in operation was positive in the first quarter. The Groups’ cruise operating expenses per Available Passenger Cruise Days (APCD) improved in the first quarter 2022 from the fourth quarter 2021 despite inflationary pressures and elevated health protocol costs.
Continued Fleet Ramp-Up
The Group’s fleet size expanded to 63 with the delivery of Wonder of the Seas and Celebrity Beyond in the first quarter and early second quarter, respectively. These ships, along with six other new ships which have joined the fleet over the last 20 months and represent over 10% of total capacity, are significantly contributing to yield growth and profitability. The Group expects its entire fleet of 63 ships will be operational by the beginning of the 2022 summer season.
The Group is now offering cruises in almost all of its destinations. Australia, one of the last remaining countries to re-open, announced the resumption of cruising effective April 2022. The Group expects to return to Australia for the local summer season in the fourth quarter of 2022. China remains closed to cruising due to the ongoing lockdowns. While the Group remains optimistic to capture long-term growth opportunities in that market, ships planned for China have been temporarily redeployed to other markets.
The Group expects to operate approximately 10.3 million Available Passenger Cruise Days (APCD) for the second quarter with load factors of 75% to 80%. The Group also expects cash flow from ships in operation to be positive in the second quarter. Operating cash flow significantly improved throughout the first quarter and is turning positive in April.
Update on Bookings
Booking volumes in the first quarter improved consistently week-over-week and reached typical Wave levels at the end of the quarter. Bookings have now been surpassing comparable 2019 levels for the last two months with particularly strong trends for North America based itineraries. In addition, the elevated cancellations experienced earlier in the year returned to pre-Omicron levels as cases subsided in February. While load factors for sailings in the second half of 2022 are currently slightly below historical levels, consumers are booking their cruises closer to sailing and the Group is capitalizing on that healthy close-in demand to improve load factors. For the full year and the second half of 2022, pricing remains higher than in 2019 both including and excluding FCCs.
Bookings for Europe sailings improved throughout the first quarter but softened due to the war in Ukraine with a bigger impact on Baltic itineraries. While bookings for Europe are now exceeding 2019 levels for the same period, the situation in Ukraine is expected to weigh on load factors in Europe this summer.
"The performance of our core business continues to strengthen, fueled by strong demand and excellent operational execution,” said Naftali Holtz, chief financial officer at Royal Caribbean Group. “Our near-term focus is to return to full operations and profitability as we execute on our recovery and build for long term success.”
As of March 31, 2022, the company's customer deposit balance was $3.6 billion. This represents an improvement of about $400 million over the previous quarter despite the significant quarter-over-quarter increase in revenue recognition and near-term cancellations due to the Omicron variant, both of which reduced the customer deposit balance. The customer deposit balance at the end of the first quarter of 2022 was similar to the March 31, 2019 balance for the three brands. Approximately 27% of the customer deposit balance is related to FCCs compared to 32% in the prior quarter, a positive trend indicating new demand. To date, approximately 56% of FCCs have been redeemed.
Liquidity and Financing Arrangements
As of March 31, 2022, the company’s liquidity position was $3.8 billion, which includes cash and cash equivalents, undrawn revolving credit facility capacity, and a $700 million commitment for a 364-day term loan facility.
In January, the company completed an issuance of $1 billion of 5.375% senior unsecured notes. These notes are due in 2027 with proceeds to be used to repay principal payments on debt maturing in 2022. In February, the company entered into a $3.15 billion backstop facility, which provides flexibility in refinancing debt maturities due in June 2023.
Net interest expense for the second quarter of 2022 is expected to be in the range of $300-$310 million.
Fuel Expense
Bunker pricing, net of hedging, for the first quarter was $588 per metric ton and consumption was 321,000 metric tons.
Consumption is 55% hedged via swaps for the remainder of 2022 and 25% hedged for 2023. For the remainder of 2022 and all 2023, the annual average cost per metric ton of the fuel swap portfolio is approximately $483 and $585, respectively.
Based on current fuel prices, the company expects approximately $271 million of fuel expense in its second quarter 2022 at an average pricing of $695 per metric ton net of hedging.
Capital Expenditures
The expected capital expenditures for 2022 are $3.0 billion. These expenditures are mainly driven by new shipbuilding projects that have committed financing.
Depreciation and amortization expenses for the second quarter of 2022 are expected to be in the range of $350-$355 million.
CONFERENCE CALL SCHEDULED
The Company has scheduled a conference call at 10:00 a.m. Eastern Time today. This call can be heard, either live or on a delayed basis, on the Company's Investor Relations website at www.rclinvestor.com.
About Royal Caribbean Group
Royal Caribbean Group (NYSE: RCL) is one of the leading cruise companies in the world with a global fleet of 63 ships traveling to approximately 1,000 destinations around the world. Royal Caribbean Group is the owner and operator of three award winning cruise brands: Royal Caribbean International, Celebrity Cruises, and Silversea Cruises and it is also a 50% owner of a joint venture that operates TUI Cruises and Hapag-Lloyd Cruises. Together, the brands have an additional 11 ships on order as of March 31, 2022. Learn more at www.royalcaribbeangroup.com or www.rclinvestor.com.
Cautionary Statement Concerning Forward-Looking Statements
Certain statements in this press release relating to, among other things, our future performance estimates, forecasts and projections constitute forward-looking statements under the Private Securities Litigation Reform Act of 1995. These statements include, but are not limited to: statements regarding revenues, costs and financial results for 2021 and beyond. Words such as “anticipate,” “believe,” “could,” “driving,” “estimate,” “expect,” “goal,” “intend,” “may,” “plan,” “project,” “seek,” “should,” “will,” “would,” “considering”, and similar expressions are intended to help identify forward-looking statements. Forward-looking statements reflect management’s current expectations, are based on judgments, are inherently uncertain and are subject to risks, uncertainties and other factors, which could cause our actual results, performance or achievements to differ materially from the future results, performance or achievements expressed or implied in those forward-looking statements. Examples of these risks, uncertainties and other factors include, but are not limited to the following: the impact of the global incidence and spread of COVID-19, which has led to the temporary suspension of our operations and has had and will continue to have a material adverse impact on our business, liquidity and results of operations, or other contagious illnesses on economic conditions and the travel industry in general and the financial position and operating results of our Company in particular, such as: the current and potential additional governmental and self-imposed travel restrictions, the current and potential extension of the suspension of cruises and new additional suspensions, guest cancellations; our ability to obtain sufficient financing, capital or revenues to satisfy liquidity needs, capital expenditures, debt repayments and other financing needs; the effectiveness of the actions we have taken to improve and address our liquidity needs; the impact of the economic and geopolitical environment on key aspects of our business including the conflict between Ukraine and Russia, such as the demand for cruises, passenger spending, and operating costs; incidents or adverse publicity concerning our ships, port facilities, land destinations and/or passengers or the cruise vacation industry in general; our ability to accurately estimate our monthly cash burn rate during the suspension of our operations; concerns over safety, health and security of guests and crew; any protocols we adopt across our fleet relating to COVID-19, such as those recommended by the Healthy Sail Panel, may be costly and less effective than we expect in reducing the risk of infection and spread of COVID-19 on our cruise ships; further impairments of our goodwill, long-lived assets, equity investments and notes receivable; an inability to source our crew or our provisions and supplies from certain places; the incurrence of COVID-19 and other contagious diseases on our ships and an increase in concern about the risk of illness on our ships or when traveling to or from our ships, all of which reduces demand; unavailability of ports of call; growing anti-tourism sentiments and environmental concerns; changes in US foreign travel policy; the uncertainties of conducting business internationally and expanding into new markets and new ventures; our ability to recruit, develop and retain high quality personnel; changes in operating and financing costs; our indebtedness, any additional indebtedness we may incur and restrictions in the agreements governing our indebtedness that limit our flexibility in operating our business, including the significant portion of assets that are collateral under these agreements; the impact of foreign currency exchange rates, interest rate and fuel price fluctuations; the settlement of conversions of our convertible notes, if any, in shares of our common stock or a combination of cash and shares of our common stock, which may result in substantial dilution for our existing shareholders; our expectation that we will not declare or pay dividends on our common stock for the near future; vacation industry competition and changes in industry capacity and overcapacity; the risks and costs related to cyber security attacks, data breaches, protecting our systems and maintaining integrity and security of our business information, as well as personal data of our guests, employees and others; the impact of new or changing legislation and regulations or governmental orders on our business; pending or threatened litigation, investigations and enforcement actions; the effects of weather, natural disasters and seasonality on our business; emergency ship repairs, including the related lost revenue; the impact of issues at shipyards, including ship delivery delays, ship cancellations or ship construction cost increases; shipyard unavailability; the unavailability or cost of air service; and uncertainties of a foreign legal system as we are not incorporated in the United States.
In addition, many of these risks and uncertainties are currently heightened by and will continue to be heightened by, or in the future may be heightened by, the COVID-19 pandemic. It is not possible to predict or identify all such risks.
More information about factors that could affect our operating results is included under the caption “Risk Factors” in our most recent annual report on Form 10-K, as well as our other filings with the SEC, and the captions “Risk Factors” and “Management’s Discussion and Analysis of Financial Condition and Results of Operations” in our most recent annual report on Form 10-K, copies of which may be obtained by visiting our Investor Relations website at www.rclinvestor.com or the SEC’s website at www.sec.gov. Undue reliance should not be placed on the forward-looking statements in this release, which are based on information available to us on the date hereof. We undertake no obligation to publicly update or revise any forward-looking statements, whether as a result of new information, future events or otherwise.
Definitions
Selected Operational and Financial Metrics
Adjusted Loss per Share (“Adjusted EPS”)
Represents Adjusted Net Loss divided by weighted average shares outstanding or by diluted weighted average shares outstanding, as applicable. We believe that this non-GAAP measure is meaningful when assessing our performance on a comparative basis.
Adjusted Net Loss
Adjusted Net Loss represents net loss excluding certain items that we believe adjusting for is meaningful when assessing our performance on a comparative basis. For the periods presented, these items included (i) impairment and credit losses (recoveries); (ii) restructuring charges and other initiative expenses; (iii) the amortization of the Silversea Cruises intangible assets resulting from the Silversea Cruises acquisition in 2018; (iv) the amortization of non-cash debt discount on our convertible notes; (v) the estimated cash refunds expected to be paid to Pullmantur guests as part of the Pullmantur S.A. reorganization in 2020; (vi) loss on the extinguishment of debt; (vii) equity investment asset impairments; (viii) net insurance recoveries related to the collapse of the drydock structure at the Grand Bahama Shipyard involving Oasis of the Seas; and (ix) the net gain recognized in the first quarter of 2021 in relation to the sale of the Azamara brand.
Available Passenger Cruise Days ("APCD")
Available Passenger Cruise Days is our measurement of capacity and represents double occupancy per cabin multiplied by the number of cruise days for the period, which excludes canceled cruise days and cabins not available for sale. We use this measure to perform capacity and rate analysis to identify our main non-capacity drivers that cause our cruise revenue and expenses to vary.
Occupancy
Occupancy, in accordance with cruise vacation industry practice, is calculated by dividing Passenger Cruise Days by APCD. A percentage in excess of 100% indicates that three or more passengers occupied some cabins.
Passenger Cruise Days
Passenger Cruise Days represent the number of passengers carried for the period multiplied by the number of days of their respective cruises.
For additional information see “Adjusted Measures of Financial Performance” below.
Adjusted Measures of Financial Performance
This press release includes certain adjusted financial measures defined as non-GAAP financial measures under Securities and Exchange Commission rules, which we believe provide useful information to investors as a supplement to our consolidated financial statements, which are prepared and presented in accordance with generally accepted accounting principles, or US GAAP.
The presentation of adjusted financial information is not intended to be considered in isolation or as a substitute for, or superior to, the financial information prepared and presented in accordance with US GAAP. These measures may be different from adjusted measures used by other companies. In addition, these adjusted measures are not based on any comprehensive set of accounting rules or principles. Adjusted measures have limitations in that they do not reflect all of the amounts associated with our results of operations as do the corresponding US GAAP measures.
A reconciliation to the most comparable US GAAP measure of all adjusted financial measures included in this press release can be found in the tables included at the end of this press release.
|
ROYAL CARIBBEAN CRUISES LTD. |
|||
|
CONSOLIDATED STATEMENTS OF COMPREHENSIVE LOSS |
|||
|
(unaudited, in thousands, except per share data) |
|||
|
|
|
|
|
|
|
Quarter Ended |
||
|
|
March 31, |
||
|
|
2022 |
|
2021 |
|
Passenger ticket revenues |
$ 651,858 |
|
$ 20,844 |
|
Onboard and other revenues |
407,373 |
|
21,170 |
|
Total revenues |
1,059,231 |
|
42,014 |
|
Cruise operating expenses: |
|
|
|
|
Commissions, transportation and other |
150,343 |
|
2,949 |
|
Onboard and other |
74,439 |
|
4,481 |
|
Payroll and related |
349,618 |
|
96,636 |
|
Food |
100,184 |
|
8,472 |
|
Fuel |
188,480 |
|
41,822 |
|
Other operating |
321,705 |
|
129,127 |
|
Total cruise operating expenses |
1,184,769 |
|
283,487 |
|
Marketing, selling and administrative expenses |
394,030 |
|
258,041 |
|
Depreciation and amortization expenses |
339,467 |
|
310,166 |
|
Impairment and credit losses (recoveries) |
173 |
|
(449) |
|
Operating Loss |
(859,208) |
|
(809,231) |
|
Other income (expense): |
|
|
|
|
Interest income |
3,322 |
|
4,861 |
|
Interest expense, net of interest capitalized |
(277,659) |
|
(272,514) |
|
Equity investment loss |
(31,059) |
|
(59,871) |
|
Other (expense) income |
(2,538) |
|
5,033 |
|
|
(307,934) |
|
(322,491) |
|
Net Loss |
$ (1,167,142) |
|
$ (1,131,722) |
|
Loss per Share: |
|
|
|
|
Basic |
$ (4.58) |
|
$ (4.66) |
|
Diluted |
$ (4.58) |
|
$ (4.66) |
|
Weighted-Average Shares Outstanding: |
|
|
|
|
Basic |
254,821 |
|
243,004 |
|
Diluted |
254,821 |
|
243,004 |
|
|
|
|
|
|
Comprehensive Loss |
|
|
|
|
Net Loss |
$ (1,167,142) |
|
$ (1,131,722) |
|
Other comprehensive income: |
|
|
|
|
Foreign currency translation adjustments |
7,778 |
|
9,722 |
|
Change in defined benefit plans |
12,597 |
|
10,463 |
|
Gain on cash flow derivative hedges |
195,901 |
|
10,302 |
|
Total other comprehensive income |
216,276 |
|
30,487 |
|
Comprehensive Loss |
$ (950,866) |
|
$ (1,101,235) |
|
|
|
|
|
|
ROYAL CARIBBEAN CRUISES LTD. |
|
STATISTICS |
|
(unaudited) |
|
|
Quarter Ended |
||
|
|
March 31, |
||
|
|
2022 |
|
2021 |
|
|
|
||
|
Passengers Carried |
734,809 |
|
41,209 |
|
Passenger Cruise Days |
4,418,899 |
|
144,916 |
|
APCD |
7,692,906 |
|
384,224 |
|
Occupancy |
57.4 % |
|
37.7 % |
|
ROYAL CARIBBEAN CRUISES LTD. |
|||
|
CONSOLIDATED BALANCE SHEETS |
|||
|
(in thousands, except share data) |
|||
|
|
As of |
||
|
|
March 31, |
|
December 31, |
|
|
2022 |
|
2021 |
|
|
(unaudited) |
|
|
|
Assets |
|
|
|
|
Current assets |
|
|
|
|
Cash and cash equivalents |
$ 1,968,504 |
|
$ 2,701,770 |
|
Trade and other receivables, net of allowances of $6,099 and $13,411 at March 31, 2022 and December 31, 2021, respectively |
506,160 |
|
408,067 |
|
Inventories |
179,466 |
|
150,224 |
|
Prepaid expenses and other assets |
344,648 |
|
286,026 |
|
Derivative financial instruments |
178,161 |
|
54,184 |
|
Total current assets |
3,176,939 |
|
3,600,271 |
|
Property and equipment, net |
26,940,867 |
|
25,907,949 |
|
Operating lease right-of-use assets |
535,532 |
|
542,128 |
|
Goodwill |
809,435 |
|
809,383 |
|
Other assets, net of allowances of $86,594 and $86,781 at March 31, 2022 and December 31, 2021, respectively |
1,477,225 |
|
1,398,624 |
|
Total assets |
$ 32,939,998 |
|
$ 32,258,355 |
|
Liabilities and Shareholders’ Equity |
|
|
|
|
Current liabilities |
|
|
|
|
Current portion of long-term debt |
$ 2,558,463 |
|
$ 2,243,131 |
|
Current portion of operating lease liabilities |
74,234 |
|
68,922 |
|
Accounts payable |
668,158 |
|
545,978 |
|
Accrued interest |
263,347 |
|
251,974 |
|
Accrued expenses and other liabilities |
774,007 |
|
887,575 |
|
Derivative financial instruments |
101,554 |
|
127,236 |
|
Customer deposits |
3,567,401 |
|
3,160,867 |
|
Total current liabilities |
8,007,164 |
|
7,285,683 |
|
Long-term debt |
19,943,513 |
|
18,847,209 |
|
Long-term operating lease liabilities |
523,924 |
|
534,726 |
|
Other long-term liabilities |
476,469 |
|
505,181 |
|
Total liabilities |
28,951,070 |
|
27,172,799 |
|
|
|
|
|
|
Shareholders’ equity |
|
|
|
|
Preferred stock ($0.01 par value; 20,000,000 shares authorized; none outstanding) |
— |
|
— |
|
Common stock ($0.01 par value; 500,000,000 shares authorized; 282,973,716 and 282,703,246 shares issued, March 31, 2022 and December 31, 2021, respectively) |
2,830 |
|
2,827 |
|
Paid-in capital |
7,267,545 |
|
7,557,297 |
|
Retained (deficit) earnings |
(718,609) |
|
302,276 |
|
Accumulated other comprehensive loss |
(494,609) |
|
(710,885) |
|
Treasury stock (28,018,385 and 27,882,987 common shares at cost, March 31, 2022 and December 31, 2021, respectively) |
(2,068,229) |
|
(2,065,959) |
|
Total shareholders’ equity |
3,988,928 |
|
5,085,556 |
|
Total liabilities and shareholders’ equity |
$ 32,939,998 |
|
$ 32,258,355 |
|
ROYAL CARIBBEAN CRUISES LTD. |
|||
|
CONSOLIDATED STATEMENTS OF CASH FLOWS |
|||
|
(unaudited, in thousands) |
|||
|
|
|
|
|
|
|
Three Months Ended March 31, |
||
|
|
2022 |
|
2021 |
|
Operating Activities |
|
|
|
|
Net Loss |
$ (1,167,142) |
|
$ (1,131,722) |
|
Adjustments: |
|
|
|
|
Depreciation and amortization |
339,467 |
|
310,166 |
|
Impairment and credit losses (recoveries) |
173 |
|
(449) |
|
Net deferred income tax benefit |
(3,067) |
|
(3,556) |
|
Loss on derivative instruments not designated as hedges |
10,873 |
|
491 |
|
Share-based compensation expense |
22,839 |
|
18,834 |
|
Equity investment loss |
31,059 |
|
59,871 |
|
Amortization of debt issuance costs |
39,341 |
|
35,581 |
|
Amortization of debt discounts and premiums |
3,849 |
|
29,304 |
|
Changes in operating assets and liabilities: |
|
|
|
|
Increase in trade and other receivables, net |
(32,236) |
|
(72,397) |
|
Increase in inventories |
(29,242) |
|
(3,708) |
|
Increase in prepaid expenses and other assets |
(124,394) |
|
(26,118) |
|
Increase (decrease) in accounts payable |
112,426 |
|
(7,499) |
|
Increase (decrease) in accrued interest |
11,373 |
|
(15,726) |
|
Decrease in accrued expenses and other liabilities |
(130,441) |
|
(134,113) |
|
Increase in customer deposits |
406,534 |
|
95,923 |
|
Other, net |
(20,259) |
|
35,935 |
|
Net cash used in operating activities |
(528,847) |
|
(809,183) |
|
Investing Activities |
|
|
|
|
Purchases of property and equipment |
(1,363,086) |
|
(1,061,691) |
|
Cash received on settlement of derivative financial instruments |
5,650 |
|
3,758 |
|
Cash paid on settlement of derivative financial instruments |
(77,853) |
|
(27,362) |
|
Investments in and loans to unconsolidated affiliates |
— |
|
(70,369) |
|
Cash received on loans to unconsolidated affiliates |
4,444 |
|
12,519 |
|
Proceeds from the sale of property and equipment and other assets |
65 |
|
175,439 |
|
Other, net |
(12,361) |
|
146 |
|
Net cash used in investing activities |
(1,443,141) |
|
(967,560) |
|
Financing Activities |
|
|
|
|
Debt proceeds |
2,349,969 |
|
2,494,077 |
|
Debt issuance costs |
(93,763) |
|
(82,115) |
|
Repayments of debt |
(1,007,632) |
|
(427,978) |
|
Repayments of commercial paper notes |
— |
|
(414,570) |
|
Proceeds from common stock issuances |
— |
|
1,617,234 |
|
Other, net |
(10,843) |
|
(2,724) |
|
Net cash provided by financing activities |
1,237,731 |
|
3,183,924 |
|
Effect of exchange rate changes on cash |
991 |
|
(192) |
|
Net (decrease) increase in cash and cash equivalents |
(733,266) |
|
1,406,989 |
|
Cash and cash equivalents at beginning of period |
2,701,770 |
|
3,684,474 |
|
Cash and cash equivalents at end of period |
$ 1,968,504 |
|
$ 5,091,463 |
|
Supplemental Disclosure |
|
|
|
|
Cash paid during the period for: |
|
|
|
|
Interest, net of amount capitalized |
$ 225,771 |
|
$ 228,877 |
|
Non-cash Investing Activities |
|
|
|
|
Notes receivable issued upon sale of property and equipment and other assets |
$ — |
|
$ 16,000 |
|
Purchase of property and equipment included in accounts payable and accrued expenses and other liabilities |
$ 31,899 |
|
$ 26,882 |
|
ROYAL CARIBBEAN CRUISES LTD. |
|||
|
NON-GAAP RECONCILING INFORMATION |
|||
|
(unaudited) |
|||
|
Adjusted Net Loss and Adjusted Loss per Share were calculated as follows (in thousands, except per share data): |
|||
|
|
Quarter Ended March 31, |
||
|
|
2022 |
|
2021 |
|
Net Loss |
$ (1,167,142) |
|
$ (1,131,722) |
|
Adjusted Net Loss |
(1,164,373) |
|
(1,078,279) |
|
Net Adjustments to Net Loss |
$ 2,769 |
|
$ 53,443 |
|
Adjustments to Net Loss: |
|
|
|
|
Impairment and credit losses (recoveries) |
$ 173 |
|
$ (449) |
|
Restructuring charges and other initiatives expense |
973 |
|
1,317 |
|
Amortization of Silversea Cruises intangible assets related to Silversea Cruises acquisition |
1,623 |
|
1,623 |
|
Convertible debt amortization of debt discount (1) |
— |
|
26,073 |
|
Pullmantur reorganization settlement (2) |
— |
|
5,000 |
|
Loss on extinguishment of debt |
— |
|
1,314 |
|
Equity investment impairment (3) |
— |
|
26,042 |
|
Oasis of the Seas incident (4) |
— |
|
(1,321) |
|
Net gain related to the sale of the Azamara brand |
— |
|
(6,156) |
|
Net Adjustments to Net Loss |
$ 2,769 |
|
$ 53,443 |
|
|
|
|
|
|
Loss per Share - Diluted |
$ (4.58) |
|
$ (4.66) |
|
Adjusted Loss per Share - Diluted |
(4.57) |
|
(4.44) |
|
Net Adjustments to Loss per Share |
$ 0.01 |
|
$ 0.22 |
|
|
|
|
|
|
Adjustments to Loss per Share: |
|
|
|
|
Impairment and credit losses (recoveries) |
$ — |
|
$ — |
|
Restructuring charges and other initiatives expense |
— |
|
0.01 |
|
Amortization of Silversea Cruises intangible assets related to Silversea Cruises acquisition |
0.01 |
|
0.01 |
|
Convertible debt amortization of debt discount (1) |
— |
|
0.11 |
|
Pullmantur reorganization settlement (2) |
— |
|
0.02 |
|
Loss on extinguishment of debt |
— |
|
0.01 |
|
Equity investment impairment (3) |
— |
|
0.11 |
|
Oasis of the Seas incident (4) |
— |
|
(0.01) |
|
Net gain related to the sale of the Azamara brand |
— |
|
(0.03) |
|
Net Adjustments to Loss per Share |
$ 0.01 |
|
$ 0.22 |
|
Weighted-Average Shares Outstanding - Diluted |
254,821 |
|
243,004 |
(1) Represents the amortization of non-cash debt discount on our convertible notes.
(2) Represents estimated cash refunds expected to be paid to Pullmantur guests as part of the Pullmantur S.A. reorganization.
(3) Represents equity investment asset impairments primarily for TUI Cruises GmbH in 2021 as a result of the impact of COVID-19.
(4) Represents net insurance recoveries related to the collapse of the drydock structure at the Grand Bahama Shipyard involving Oasis of the Seas.