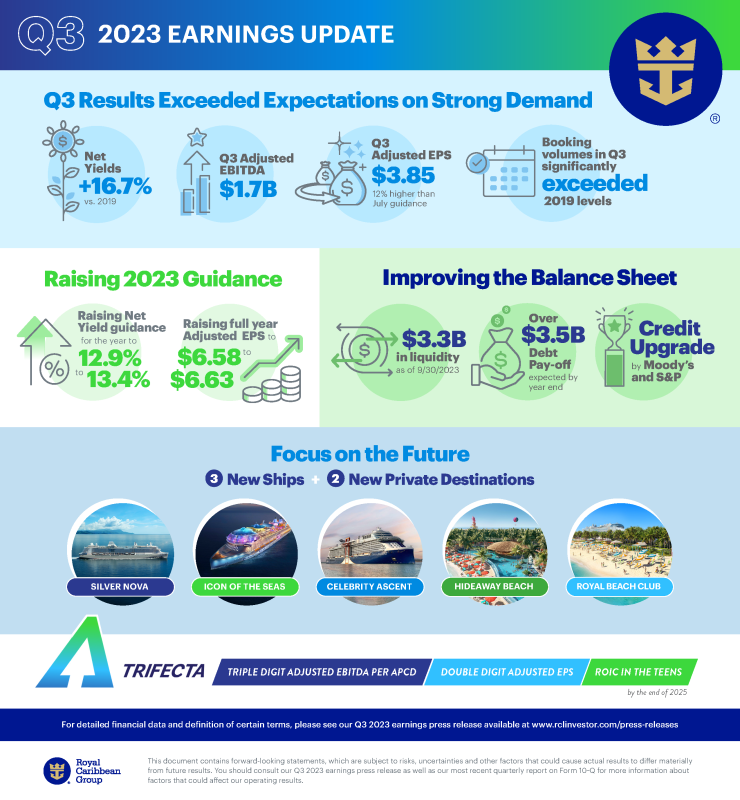
MIAMI, Oct. 26, 2023 - Royal Caribbean Group (NYSE: RCL) today reported third quarter Earnings per Share ("EPS") of $3.65 and Adjusted EPS of $3.85. These results were better than the company's guidance due to stronger close-in demand and further strength in onboard revenue. The company is also increasing its full year 2023 Adjusted EPS guidance to $6.58 – $6.63, driven by strong demand and continued strength in onboard revenue.
"The strength of our brands and the acceleration of consumer spending on experiences have propelled us towards another outstanding quarter and a robust 2023," said Jason Liberty, president and CEO, Royal Caribbean Group. "Looking ahead, we see accelerating demand as we build the business for 2024. Our booked load factors are higher than all prior years and at higher rates, further supporting our trajectory towards the Trifecta goals," added Liberty. "The combination of our leading brands, the best people, and the most innovative fleet and destinations, positions us exceptionally well to deliver on a lifetime of vacation experiences while creating long-term shareholder value."
Third Quarter 2023 Results:
Full Year 2023 Outlook:
Third Quarter 2023
The company reported Net Income for the third quarter of $1.0 billion or $3.65 per share compared to Net Income of $33.0 million or $0.13 per share for the same period in the prior year. The company also reported Adjusted Net Income of $1.1 billion or $3.85 per share for the third quarter compared to Adjusted Net Income of $65.8 million or $0.26 per share for the same period in the prior year.
Gross Margin Yields increased 19.1% As-Reported, and Net Yields increased 16.7% in Constant-Currency (16.9% As-Reported) when compared to the third quarter of 2019. Third quarter revenue across North America and Europe itineraries exceeded expectations due to better close-in demand that translated into higher load factors and pricing, as well as continued strength in onboard revenue. Load factor for the third quarter was 110%.
Gross Cruise Costs per APCD increased 14.4% As-Reported, compared to 2019. NCC, excluding Fuel, per APCD increased 10.1% As-Reported and 10.3% in Constant-Currency, compared to 2019. Lower operating expenses, as well as favorable timing, contributed to better-than-expected costs.
Revenue Environment and 2024 Outlook
Bookings remained strong throughout the third quarter, significantly exceeding 2019 levels. Closer-in demand for 2023 sailings exceeded expectations, contributing to higher load factors at higher prices and higher onboard revenue for the third quarter. Consumer spending onboard, as well as pre-cruise purchases, continue to significantly exceed 2019 levels driven by greater participation at higher prices. As of September 30, 2023, the Group's customer deposit balance was at $5.0 billion.
Demand for 2024 has continued to accelerate, with bookings significantly and consistently outpacing 2019 levels. Booked load factors and rates are higher than all prior years while the booking window has continued to extend. The market response to the company's new ships, existing hardware, and the expansion of Perfect Day at CocoCay, and Hideaway Beach, has been excellent and further positions the company for strong yield and earnings growth in 2024.
Fourth Quarter 2023
Net Yields are expected to be up 16.2% to 16.7% in Constant-Currency and 15.0% to 15.5% As-Reported, both compared to the fourth quarter of 2019. Continued strong demand for the company's vacation experiences and strength in onboard revenue contributes to increased yield expectations for the fourth quarter.
NCC, excluding Fuel, per APCD for the quarter are expected to increase 3.9% to 4.4% in Constant-Currency and 3.3% to 3.8% As-Reported, both compared to the fourth quarter of 2019.
Fuel pricing and foreign exchange rates are negatively impacting EPS by $0.15, versus previous expectations. Impacted sailings related to Israel deployment are negatively impacting the quarter by approximately $0.03.
Based on current fuel pricing, interest and currency exchange rates and the factors detailed above, the company expects fourth quarter Adjusted EPS to be $1.05 to $1.10 per share.
"The performance of our business continues to accelerate, driven by strong demand and excellent operational execution," said Naftali Holtz, chief financial officer at Royal Caribbean Group. "Our formula of moderate yield growth, strong cost discipline, and moderate growth of our fleet delivers a strong financial profile and enhanced margins."
Fuel Expense
Bunker pricing net of hedging for the third quarter was $668 per metric ton and consumption was 408,000 metric tons.
The company does not forecast fuel prices and its fuel cost calculations are based on current at-the-pump prices, net of hedging impacts. Based on today's fuel prices, the company has included $300 million of fuel expense in its fourth quarter guidance at a forecasted consumption of 413,000 metric tons, which is 54% hedged via swaps. Forecasted consumption is 54%, 60%, 39%, and 3% hedged via swaps for the remainder of 2023, 2024,2025, and 2026, respectively. The annual average cost per metric ton of the hedge portfolio is approximately $576, $509, $479 and $778 for 2023, 2024, 2025, and 2026, respectively. The higher average cost in 2026 is driven by only MGO consumption hedged that year.
The company provided the following guidance for the fourth quarter and full year 2023:
|
FUEL STATISTICS |
Fourth Quarter 2023 |
Full Year 2023 |
|
Fuel Consumption (metric tons) |
413,000 |
1,636,000 |
|
Fuel Expenses |
Approx. $300 million |
Approx. $1,150 million |
|
Percent Hedged (fwd. consumption) |
54.0 % |
54.0 % |
|
GUIDANCE |
As-Reported |
Constant Currency |
|
Fourth Quarter 2023 |
||
|
Net Yields vs. 2019 |
15.0% to 15.5% |
16.2% to 16.7% |
|
Net Cruise Costs per APCD vs. 2019 |
8.9% to 9.4% |
9.4% to 9.9% |
|
Net Cruise Costs per APCD ex. Fuel vs. 2019 |
3.3% to 3.8% |
3.9% to 4.4% |
|
Full Year 2023 |
||
|
Net Yields vs. 2019 |
12.4% to 12.9% |
12.9% to 13.4% |
|
Net Cruise Costs per APCD vs. 2019 |
11.6% to 12.1% |
12.1% to 12.6% |
|
Net Cruise Costs per APCD ex. Fuel vs. 2019 |
6.5% to 7.0% |
7.0% to 7.5% |
|
GUIDANCE |
Fourth Quarter 2023 |
Full Year 2023 |
|
APCDs |
12 million |
47 million |
|
Capacity change vs. 2019 |
15.0 % |
13.2 % |
|
Depreciation and amortization |
$365 to $375 million |
$1,450 to $1,460 million |
|
Net Interest, excluding loss on extinguishment of debt |
$305 to $315 million |
$1,245 to $1,255 million |
|
Adjusted EPS |
$1.05 to $1.10 |
$6.58 to $6.63 |
|
SENSITIVITY |
Fourth Quarter 2023 |
Full Year 2023 |
|
1% Change in Currency |
$4 million |
$15 million |
|
1% Change in Net Yields |
$23 million |
$98 million |
|
1% Change in NCC excluding Fuel |
$14 million |
$52 million |
|
100 basis pt. Change in SOFR |
$4 million |
$9 million |
|
10% Change in Fuel prices |
$30 million |
$115 million |
|
Exchange rates used in guidance calculations |
||
|
GBP |
$1.21 |
|
|
AUD |
$0.63 |
|
|
CAD |
$0.73 |
|
|
EUR |
$1.05 |
|
Liquidity and Financing Arrangements
As of September 30, 2023, the company's liquidity position was $3.3 billion, which includes cash and cash equivalents and undrawn revolving credit facility availability.
During the third quarter the company repaid $775 million of debt, including $500 million of its 11.50% senior secured notes due June 2025. Also, during the third quarter, S&P upgraded the company's credit rating to BB- with a stable outlook and Moody's upgraded the company's credit rating to B1 with a positive outlook.
In October, the company refinanced its $3.0 billion revolving credit facilities and $500 million term loan into new $3.5 billion multiyear revolving credit facilities. The execution of the new credit facilities demonstrates the continued support and confidence in the company's financial position and credit improvement. Also in late October, the company issued a redemption notice for the remaining $500 million of its 11.50% senior secured notes due June 2025. This redemption will be funded with existing liquidity.
"Our strong performance and commitment to strengthening the balance sheet will allow us to pay off over $3.5 billion of debt by the end of this year and is being favorably recognized by our financial partners and the rating agencies" said Naftali Holtz, chief financial officer, Royal Caribbean Group. "We continue to strategically invest in our future while utilizing excess cash flow to pay down debt, consistent with our Trifecta related goal of returning to investment grade metrics."
As of September 30, 2023, the scheduled debt maturities for the remainder of 2023, 2024, 2025, and 2026 were $0.7 billion, $2.3 billion, $2.8 billion, and $2.8 billion, respectively.
Capital Expenditures and Capacity Guidance
Capital expenditures for full year 2023 are expected to be $4.1 billion. The company took delivery of Silver Nova and expects to take delivery of two additional new ships, Icon of the Seas and Celebrity Ascent, in the fourth quarter of 2023. Icon of the Seas begins its revenue sailings the end of January 2024. All ship orders have committed financing in place. Non-new ship related capital expenditures in 2023 are expected to be $0.5 billion.
Capacity changes for 2023, 2024, 2025, and 2026 are expected to be 13%, 8%, 5%, and 6%, respectively. These figures do not include potential ship sales or additions that the company may elect in the future.
CONFERENCE CALL SCHEDULED
The company has scheduled a conference call at 10:00 a.m. Eastern Time today. This call can be heard, either live or on a delayed basis, on the company's Investor Relations website at www.rclinvestor.com.
About Royal Caribbean Group
Royal Caribbean Group (NYSE: RCL) is one of the leading cruise companies in the world with a global fleet of 64 ships traveling to approximately 1,000 destinations around the world. Royal Caribbean Group is the owner and operator of three award winning cruise brands: Royal Caribbean International, Celebrity Cruises, and Silversea Cruises and it is also a 50% owner of a joint venture that operates TUI Cruises and Hapag-Lloyd Cruises. Together, the brands have an additional 10 ships on order as of September 30, 2023. Learn more at www.royalcaribbeangroup.com or www.rclinvestor.com.
Cautionary Statement Concerning Forward-Looking Statements
Certain statements in this press release relating to, among other things, our future performance estimates, forecasts and projections constitute forward-looking statements under the Private Securities Litigation Reform Act of 1995. These statements include, but are not limited, to: statements regarding revenues, costs and financial results for 2023 and 2024 and beyond. Words such as "anticipate," "believe," "could," "driving," "estimate," "expect," "goal," "intend," "may," "plan," "project," "seek," "should," "will," "would," "considering," and similar expressions are intended to help identify forward-looking statements. Forward-looking statements reflect management's current expectations, are based on judgments, are inherently uncertain and are subject to risks, uncertainties and other factors which could cause our actual results, performance or achievements to differ materially from the future results, performance or achievements expressed or implied in those forward-looking statements. Examples of these risks, uncertainties and other factors include, but are not limited to, the following: the impact of contagious illnesses on economic conditions and the travel industry in general and the financial position and operating results of our Company in particular, such as: governmental and self-imposed travel restrictions and guest cancellations; our ability to obtain sufficient financing, capital or revenues to satisfy liquidity needs, capital expenditures, debt repayments and other financing needs; the effectiveness of the actions we have taken to improve and address our liquidity needs; the impact of the economic and geopolitical environment on key aspects of our business, such as the demand for cruises, passenger spending, and operating costs; incidents or adverse publicity concerning our ships, port facilities, land destinations and/or passengers or the cruise vacation industry in general; concerns over safety, health and security of guests and crew; further impairments of our goodwill, long-lived assets, equity investments and notes receivable; an inability to source our crew or our provisions and supplies from certain places; an increase in concern about the risk of illness on our ships or when travelling to or from our ships, all of which reduces demand; unavailability of ports of call; growing anti-tourism sentiments and environmental concerns; changes in U.S. foreign travel policy; the uncertainties of conducting business internationally and expanding into new markets and new ventures; our ability to recruit, develop and retain high quality personnel; changes in operating and financing costs; our indebtedness, any additional indebtedness we may incur and restrictions in the agreements governing our indebtedness that limit our flexibility in operating our business; the impact of foreign currency exchange rates, the impact of higher interest rate and food and fuel prices; the settlement of conversions of our convertible notes, if any, in shares of our common stock or a combination of cash and shares of our common stock, which may result in substantial dilution for our existing shareholders; our expectation that we will not declare or pay dividends on our common stock for the near future; vacation industry competition and changes in industry capacity and overcapacity; the risks and costs related to cyber security attacks, data breaches, protecting our systems and maintaining integrity and security of our business information, as well as personal data of our guests, employees and others; the impact of new or changing legislation and regulations (including environmental regulations) or governmental orders on our business; pending or threatened litigation, investigations and enforcement actions; the effects of weather, natural disasters and seasonality on our business; the impact of issues at shipyards, including ship delivery delays, ship cancellations or ship construction cost increases; shipyard unavailability; the unavailability or cost of air service; and uncertainties of a foreign legal system as we are not incorporated in the United States.
More information about factors that could affect our operating results is included under the caption "Risk Factors" in our most recent quarterly report on Form 10-Q, as well as our other filings with the SEC, copies of which may be obtained by visiting our Investor Relations website at www.rclinvestor.com or the SEC's website at www.sec.gov. Undue reliance should not be placed on the forward-looking statements in this release, which are based on information available to us on the date hereof. We undertake no obligation to publicly update or revise any forward-looking statements, whether as a result of new information, future events or otherwise.
Definitions
Selected Operational and Financial Metrics
Adjusted EBITDA is a non-GAAP measure that represents EBITDA (as defined below) excluding certain items that we believe adjusting for is meaningful when assessing our profitability on a comparative basis. For the 2023 and 2022 periods, these items included (i) other expense (income); (ii) gain on sale of controlling interest; (iii) impairment and credit losses (recoveries); (iv) restructuring charges and other initiative expenses; and (v) equity investments impairment and recovery of losses.
Adjusted Earnings (Loss) per Share ("Adjusted EPS") is a non-GAAP measure that represents Adjusted Net Income (Loss) attributable to Royal Caribbean Cruises Ltd. (as defined below) divided by weighted average shares outstanding or by diluted weighted average shares outstanding, as applicable. We believe that this non-GAAP measure is meaningful when assessing our performance on a comparative basis.
Adjusted Net Income (Loss) attributable to Royal Caribbean Cruises Ltd. is a non-GAAP measure that represents Net Income (Loss) attributable to Royal Caribbean Cruises Ltd. excluding certain items that we believe adjusting for is meaningful when assessing our performance on a comparative basis. For the periods presented, these items included (i) loss on extinguishment of debt; (ii) gain on sale of controlling interest; (iii) tax on the sale of PortMiami noncontrolling interest; (iv) Silver Whisper deferred tax liability release; (v) impairment and credit losses (recoveries); (vi) the amortization of the Silversea Cruises intangible assets resulting from the Silversea Cruises acquisition in 2018; (vii) restructuring charges and other initiative expenses; and (viii) equity investments impairment and recovery of losses.
Available Passenger Cruise Days ("APCD") is our measurement of capacity and represents double occupancy per cabin multiplied by the number of cruise days for the period, which excludes canceled cruise days and cabins not available for sale. We use this measure to perform capacity and rate analysis to identify our main non-capacity drivers that cause our cruise revenue and expenses to vary.
Constant Currency is a significant measure for our revenues and expenses, which are denominated in currencies other than the U.S. Dollar. Because our reporting currency is the U.S. Dollar, the value of these revenues and expenses in U.S. Dollar will be affected by changes in currency exchange rates. Although such changes in local currency prices are just one of many elements impacting our revenues and expenses, it can be an important element. For this reason, we also monitor our revenues and expenses in "Constant Currency" - i.e., as if the current period's currency exchange rates had remained constant with the comparable prior period's rates. For the 2023 periods presented, we calculate "Constant Currency" by applying the average 2019 period exchange rates for each of the corresponding months of the reported and/or forecasted period, so as to calculate what the results would have been had exchange rates been the same throughout both periods. We do not make predictions about future exchange rates and use current exchange rates for calculations of future periods. It should be emphasized that the use of Constant Currency is primarily used by us for comparing short-term changes and/or projections. Over the longer term, changes in guest sourcing and shifting the amount of purchases between currencies can significantly change the impact of the purely currency-based fluctuations.
EBITDA is a non-GAAP measure that represents Net Income (Loss) attributable to Royal Caribbean Cruises Ltd. excluding (i) interest income; (ii) interest expense, net of interest capitalized; (iii) depreciation and amortization expenses; and (iv) income tax benefit or expense. We believe that this non-GAAP measure is meaningful when assessing our operating performance on a comparative basis.
Invested Capital represents the most recent five-quarter average of total debt (i.e., Current portion of long-term debt plus Long-term debt) plus Total shareholders' equity. We use this measure to calculate ROIC (as defined below).
Occupancy ("Load Factor"), in accordance with cruise vacation industry practice, is calculated by dividing Passenger Cruise Days (as defined below) by APCD. A percentage in excess of 100% indicates that three or more passengers occupied some cabins.
Passenger Cruise Days represent the number of passengers carried for the period multiplied by the number of days of their respective cruises.
Gross Cruise Costs represent the sum of total cruise operating expenses plus marketing, selling and administrative expenses.
Net Cruise Costs ("NCC") and NCC excluding Fuel are non-GAAP measures that represent Gross Cruise Costs excluding commissions, transportation and other expenses, and onboard and other expenses and, in the case of Net Cruise Costs excluding Fuel, fuel expenses. For the 2023 and 2019 periods presented, Net Cruise Costs and Net Cruise Costs excluding Fuel exclude (i) the gain on sale of controlling interest; (ii) impairment and credit losses (recoveries); (iii) restructuring charges and other initiative expenses; (iv) the transaction and integration costs related to the Silversea Cruises acquisition incidental; and (v) the costs related to the Oasis of the Seas incident included within cruise operating expenses. In measuring our ability to control costs in a manner that positively impacts net income, we believe changes in Net Cruise Costs and Net Cruise Costs excluding Fuel to be the most relevant indicators of our performance.
Gross Margin Yield represent Gross Margin per APCD.
Adjusted Gross Margin represent Gross Margin, adjusted for payroll and related, food, fuel, other operating expenses, and depreciation and amortization. Gross Margin is calculated pursuant to GAAP as total revenues less total cruise operating expenses, and depreciation and amortization.
Net Yields represent Adjusted Gross Margin per APCD. We utilize Adjusted Gross Margin and Net Yields to manage our business on a day-to-day basis as we believe that they are the most relevant measures of our pricing performance because they reflect the cruise revenues earned by us net of our most significant variable costs, which are commissions, transportation and other expenses, and onboard and other expenses.
Adjusted Operating Income (Loss) is a non-GAAP measure that represents operating income (loss) including income (loss) from equity investments and income taxes but excluding certain items that we believe adjusting for is meaningful when assessing our operating performance on a comparative basis. We use this non-GAAP measure to calculate ROIC (as defined below).
Return on Invested Capital ("ROIC") represents Adjusted Operating Income (Loss) divided by Invested Capital. We believe ROIC is a meaningful measure because it quantifies how efficiently we generated operating income relative to the capital we have invested in the business. ROIC is also used as a key metric in our long-term incentive compensation program for our executive officers.
Trifecta refers to the multi-year Adjusted EBITDA per APCD, Adjusted EPS and ROIC goals we publicly announced in November 2022 and are seeking to achieve by the end of 2025. We designed this program to help us better execute and achieve our business goals by clearly articulating longer-term financial objectives. Under the Trifecta Program, we are targeting Adjusted EBITDA per APCD of at least $100, Adjusted EPS of at least $10, and ROIC of 13% or higher by the end of 2025.
For additional information see "Adjusted Measures of Financial Performance" below.
Adjusted Measures of Financial Performance
This press release includes certain adjusted financial measures defined as non-GAAP financial measures under Securities and Exchange Commission rules, which we believe provide useful information to investors as a supplement to our consolidated financial statements, which are prepared and presented in accordance with generally accepted accounting principles, or U.S. GAAP.
The presentation of adjusted financial information is not intended to be considered in isolation or as a substitute for, or superior to, the financial information prepared and presented in accordance with U.S. GAAP. These measures may be different from adjusted measures used by other companies. In addition, these adjusted measures are not based on any comprehensive set of accounting rules or principles. Adjusted measures have limitations in that they do not reflect all of the amounts associated with our results of operations as do the corresponding U.S. GAAP measures.
A reconciliation to the most comparable U.S. GAAP measure of all adjusted financial measures included in this press release can be found in the tables included at the end of this press release. We have not provided a quantitative reconciliation of the projected non-GAAP financial measures to the most comparable GAAP financial measures because preparation of meaningful U.S. GAAP projections would require unreasonable effort. Due to significant uncertainty, we are unable to predict, without unreasonable effort, the future movement of foreign exchange rates, fuel prices and interest rates inclusive of our related hedging programs. In addition, we are unable to determine the future impact of non-core business related gains and losses which may result from strategic initiatives. These items are uncertain and could be material to our results of operations in accordance with U.S. GAAP. Due to this uncertainty, we do not believe that reconciling information for such projected figures would be meaningful.
|
ROYAL CARIBBEAN CRUISES LTD. |
|||||||
|
CONSOLIDATED STATEMENTS OF COMPREHENSIVE INCOME (LOSS) |
|||||||
|
(unaudited; in thousands, except per share data) |
|||||||
|
Quarter Ended |
Nine Months Ended |
||||||
|
September 30, |
September 30, |
||||||
|
2023 |
2022 |
2023 |
2022 |
||||
|
Passenger ticket revenues |
$ 2,941,481 |
$ 2,020,974 |
$ 7,281,503 |
$ 4,091,035 |
|||
|
Onboard and other revenues |
1,218,972 |
972,101 |
3,287,078 |
2,145,513 |
|||
|
Total revenues |
4,160,453 |
2,993,075 |
10,568,581 |
6,236,548 |
|||
|
Cruise operating expenses: |
|||||||
|
Commissions, transportation and other |
632,075 |
484,054 |
1,551,012 |
964,256 |
|||
|
Onboard and other |
261,225 |
220,216 |
640,175 |
450,225 |
|||
|
Payroll and related |
293,629 |
304,369 |
887,999 |
981,128 |
|||
|
Food |
211,709 |
194,966 |
613,795 |
450,376 |
|||
|
Fuel |
272,408 |
316,214 |
849,839 |
779,873 |
|||
|
Other operating |
465,814 |
446,630 |
1,341,821 |
1,205,452 |
|||
|
Total cruise operating expenses |
2,136,860 |
1,966,449 |
5,884,641 |
4,831,310 |
|||
|
Marketing, selling and administrative expenses |
393,016 |
373,116 |
1,288,719 |
1,138,571 |
|||
|
Depreciation and amortization expenses |
365,473 |
355,085 |
1,086,923 |
1,046,094 |
|||
|
Operating Income (Loss) |
1,265,104 |
298,425 |
2,308,298 |
(779,427) |
|||
|
Other income (expense): |
|||||||
|
Interest income |
7,472 |
11,953 |
31,863 |
21,765 |
|||
|
Interest expense, net of interest capitalized |
(340,620) |
(352,187) |
(1,055,519) |
(932,552) |
|||
|
Equity investment income |
86,627 |
73,997 |
149,112 |
29,759 |
|||
|
Other (expense) income |
(7,905) |
780 |
(8,676) |
4,699 |
|||
|
(254,426) |
(265,457) |
(883,220) |
(876,329) |
||||
|
Net Income (Loss) |
1,010,678 |
32,968 |
1,425,078 |
(1,655,756) |
|||
|
Less: Net Income attributable to noncontrolling interest |
1,602 |
— |
5,151 |
— |
|||
|
Net Income (Loss) attributable to Royal Caribbean |
$ 1,009,076 |
$ 32,968 |
$ 1,419,927 |
$ (1,655,756) |
|||
|
Earnings (Loss) per Share: |
|||||||
|
Basic |
$ 3.94 |
$ 0.13 |
$ 5.55 |
$ (6.49) |
|||
|
Diluted |
$ 3.65 |
$ 0.13 |
$ 5.24 |
$ (6.49) |
|||
|
Weighted-Average Shares Outstanding: |
|||||||
|
Basic |
256,188 |
255,071 |
255,822 |
254,953 |
|||
|
Diluted |
281,876 |
255,378 |
283,847 |
254,953 |
|||
|
Comprehensive Income (Loss) |
|||||||
|
Net Income (Loss) |
$ 1,010,678 |
$ 32,968 |
$ 1,425,078 |
$ (1,655,756) |
|||
|
Other comprehensive income (loss): |
|||||||
|
Foreign currency translation adjustments |
11,495 |
11,498 |
1,686 |
31,958 |
|||
|
Change in defined benefit plans |
3,972 |
7,226 |
3,700 |
34,991 |
|||
|
Gain (loss) on cash flow derivative hedges |
19,561 |
(259,949) |
(7,148) |
(148,541) |
|||
|
Total other comprehensive income (loss) |
35,028 |
(241,225) |
(1,762) |
(81,592) |
|||
|
Comprehensive Income (Loss) |
1,045,706 |
(208,257) |
1,423,316 |
(1,737,348) |
|||
|
Less: Comprehensive Income attributable to noncontrolling |
1,602 |
— |
5,151 |
— |
|||
|
Comprehensive Income (Loss) attributable to Royal |
$ 1,044,104 |
$ (208,257) |
$ 1,418,165 |
$ (1,737,348) |
|||
|
ROYAL CARIBBEAN CRUISES LTD. |
|||||||||||
|
STATISTICS |
|||||||||||
|
(unaudited) |
|||||||||||
|
Quarter Ended |
Nine Months Ended |
||||||||||
|
September 30, |
September 30, |
||||||||||
|
2023 |
2022 |
2019 |
2023 |
2022 |
2019 |
||||||
|
Passengers Carried |
1,999,764 |
1,714,774 |
1,728,997 |
5,706,843 |
3,790,205 |
4,926,123 |
|||||
|
Passenger Cruise Days |
13,172,002 |
11,136,331 |
11,863,189 |
36,944,034 |
23,998,975 |
33,746,534 |
|||||
|
APCD |
12,011,593 |
11,564,662 |
10,733,254 |
34,953,919 |
29,553,564 |
31,031,274 |
|||||
|
Occupancy |
109.7 % |
96.3 % |
110.5 % |
105.7 % |
81.2 % |
108.8 % |
|||||
|
ROYAL CARIBBEAN CRUISES LTD. |
|||
|
CONSOLIDATED BALANCE SHEETS |
|||
|
(in thousands, except share data) |
|||
|
As of |
|||
|
September 30, |
December 31, |
||
|
2023 |
2022 |
||
|
(unaudited) |
|||
|
Assets |
|||
|
Current assets |
|||
|
Cash and cash equivalents |
$ 600,117 |
$ 1,935,005 |
|
|
Trade and other receivables, net of allowances of $7,899 and $11,612 at September 30, 2023 |
360,151 |
531,066 |
|
|
Inventories |
241,522 |
224,016 |
|
|
Prepaid expenses and other assets |
508,832 |
455,836 |
|
|
Derivative financial instruments |
70,087 |
59,083 |
|
|
Total current assets |
1,780,709 |
3,205,006 |
|
|
Property and equipment, net |
27,854,624 |
27,546,445 |
|
|
Operating lease right-of-use assets |
529,721 |
537,559 |
|
|
Goodwill |
809,206 |
809,277 |
|
|
Other assets, net of allowances of $62,777 and $71,614 at September 30, 2023 and |
1,794,412 |
1,678,074 |
|
|
Total assets |
$ 32,768,672 |
$ 33,776,361 |
|
|
Liabilities and Shareholders' Equity |
|||
|
Current liabilities |
|||
|
Current portion of long-term debt |
$ 2,043,965 |
$ 2,087,711 |
|
|
Current portion of operating lease liabilities |
80,983 |
79,760 |
|
|
Accounts payable |
715,386 |
646,727 |
|
|
Accrued expenses and other liabilities |
1,210,858 |
1,459,957 |
|
|
Derivative financial instruments |
158,165 |
131,312 |
|
|
Customer deposits |
5,032,328 |
4,167,997 |
|
|
Total current liabilities |
9,241,685 |
8,573,464 |
|
|
Long-term debt |
17,924,927 |
21,303,480 |
|
|
Long-term operating lease liabilities |
517,337 |
523,006 |
|
|
Other long-term liabilities |
488,534 |
507,599 |
|
|
Total liabilities |
28,172,483 |
30,907,549 |
|
|
Shareholders' equity |
|||
|
Preferred stock ($0.01 par value; 20,000,000 shares authorized; none outstanding) |
— |
— |
|
|
Common stock ($0.01 par value; 500,000,000 shares authorized; 284,483,109 and 283,257,102 |
2,845 |
2,832 |
|
|
Paid-in capital |
7,422,041 |
7,284,852 |
|
|
Accumulated deficit |
(287,502) |
(1,707,429) |
|
|
Accumulated other comprehensive loss |
(644,976) |
(643,214) |
|
|
Treasury stock (28,248,125 and 28,018,385 common shares at cost, September 30, 2023 and |
(2,069,432) |
(2,068,229) |
|
|
Total shareholders' equity attributable to Royal Caribbean Cruises Ltd. |
4,422,976 |
2,868,812 |
|
|
Noncontrolling Interests |
173,213 |
— |
|
|
Total shareholders' equity |
4,596,189 |
2,868,812 |
|
|
Total liabilities and shareholders' equity |
$ 32,768,672 |
$ 33,776,361 |
|
|
ROYAL CARIBBEAN CRUISES LTD. |
|||
|
CONSOLIDATED STATEMENTS OF CASH FLOWS |
|||
|
(unaudited, in thousands) |
|||
|
Nine Months Ended September 30, |
|||
|
2023 |
2022 |
||
|
Operating Activities |
|||
|
Net Income (Loss) |
$ 1,425,078 |
$ (1,655,756) |
|
|
Adjustments: |
|||
|
Depreciation and amortization |
1,086,923 |
1,046,094 |
|
|
Net deferred income tax benefit |
(2,723) |
(14,345) |
|
|
Loss on derivative instruments not designated as hedges |
30,904 |
175,686 |
|
|
Share-based compensation expense |
79,315 |
24,285 |
|
|
Equity investment income |
(149,112) |
(29,759) |
|
|
Amortization of debt issuance costs, discounts and premiums |
84,015 |
129,957 |
|
|
Loss on extinguishment of debt |
81,441 |
16,449 |
|
|
Changes in operating assets and liabilities: |
|||
|
Decrease (increase) in trade and other receivables, net |
131,199 |
(173,555) |
|
|
Increase in inventories, net |
(17,506) |
(86,962) |
|
|
Increase in prepaid expenses and other assets |
(43,721) |
(108,429) |
|
|
Increase in accounts payable trade |
62,007 |
79,249 |
|
|
(Decrease) increase in accrued expenses and other liabilities |
(247,065) |
3,080 |
|
|
Increase in customer deposits |
864,332 |
613,632 |
|
|
Other, net |
(24,082) |
(114,367) |
|
|
Net cash provided by (used in) operating activities |
3,361,005 |
(94,741) |
|
|
Investing Activities |
|||
|
Purchases of property and equipment |
(1,328,643) |
(2,543,266) |
|
|
Cash received on settlement of derivative financial instruments |
23,096 |
42,958 |
|
|
Cash paid on settlement of derivative financial instruments |
(66,272) |
(389,387) |
|
|
Investments in and loans to unconsolidated affiliates |
(21,997) |
(614) |
|
|
Cash received on loans from unconsolidated affiliates |
35,583 |
14,030 |
|
|
Other, net |
9,021 |
5,328 |
|
|
Net cash used in investing activities |
(1,349,212) |
(2,870,951) |
|
|
Financing Activities |
|||
|
Debt proceeds |
1,808,177 |
7,207,566 |
|
|
Debt issuance costs |
(56,150) |
(222,787) |
|
|
Repayments of debt |
(5,305,966) |
(5,135,323) |
|
|
Proceeds from sale of noncontrolling interest |
209,320 |
— |
|
|
Other, net |
(815) |
(16,556) |
|
|
Net cash (used in) provided by financing activities |
(3,345,434) |
1,832,900 |
|
|
Effect of exchange rate changes on cash and cash equivalents |
(1,247) |
(2,765) |
|
|
Net decrease in cash and cash equivalents |
(1,334,888) |
(1,135,557) |
|
|
Cash and cash equivalents at beginning of period |
1,935,005 |
2,701,770 |
|
|
Cash and cash equivalents at end of period |
$ 600,117 |
$ 1,566,213 |
|
|
Supplemental Disclosure |
|||
|
Cash paid during the period for: |
|||
|
Interest, net of amount capitalized |
$ 1,064,031 |
$ 752,623 |
|
|
Non-cash Investing Activities |
|||
|
Purchase of property and equipment included in accounts payable and accrued |
$ 24,394 |
$ 26,026 |
|
|
Acquisition of property and equipment from assumed debt |
$ — |
$ 275,000 |
|
|
Non-cash Financing Activity |
|||
|
Debt related to purchase of property and equipment |
$ — |
$ 275,000 |
|
|
ROYAL CARIBBEAN CRUISES LTD. |
|||||||||||
|
NON-GAAP RECONCILING INFORMATION |
|||||||||||
|
(unaudited) |
|||||||||||
|
Gross Margin Yields and Net Yields were calculated by dividing Gross Margin and Adjusted Gross Margins by APCD as follows (in thousands, except APCD and Yields): |
|||||||||||
|
Quarter Ended September 30, |
Nine Months Ended September 30, |
||||||||||
|
2023 |
2023 On a |
2019 |
2023 |
2023 On a |
2019 |
||||||
|
Total revenue |
$ 4,160,453 |
$ — |
$ 3,186,850 |
$ 10,568,581 |
$ — |
$ 8,433,248 |
|||||
|
Less: |
|||||||||||
|
Cruise operating expenses |
2,136,860 |
— |
1,623,038 |
5,884,641 |
— |
4,581,246 |
|||||
|
Depreciation and |
365,473 |
— |
320,295 |
1,086,923 |
— |
924,180 |
|||||
|
Gross Margin |
1,658,120 |
1,651,955 |
1,243,517 |
3,597,017 |
3,613,208 |
2,927,822 |
|||||
|
Add: |
|||||||||||
|
Payroll and related |
293,629 |
— |
263,993 |
887,999 |
— |
799,094 |
|||||
|
Food |
211,709 |
— |
149,621 |
613,795 |
— |
436,002 |
|||||
|
Fuel |
272,408 |
— |
177,677 |
849,839 |
— |
519,772 |
|||||
|
Other operating |
465,814 |
— |
342,170 |
1,341,821 |
— |
1,037,113 |
|||||
|
Depreciation and |
365,473 |
— |
320,295 |
1,086,923 |
— |
924,180 |
|||||
|
Adjusted Gross Margin |
$ 3,267,153 |
$ 3,261,769 |
$ 2,497,273 |
$ 8,377,394 |
$ 8,396,353 |
$ 6,643,983 |
|||||
|
APCD |
12,011,593 |
12,011,593 |
10,733,254 |
34,953,919 |
34,953,919 |
31,031,274 |
|||||
|
Gross Margin Yields |
$ 138.04 |
$ 137.53 |
$ 115.86 |
$ 102.91 |
$ 103.37 |
$ 94.35 |
|||||
|
Net Yields |
$ 272.00 |
$ 271.55 |
$ 232.67 |
$ 239.67 |
$ 240.21 |
$ 214.11 |
|||||
|
ROYAL CARIBBEAN CRUISES LTD. |
|||||||||||
|
NON-GAAP RECONCILING INFORMATION |
|||||||||||
|
(unaudited) |
|||||||||||
|
Gross Cruise Costs, Net Cruise Costs and Net Cruise Costs excluding Fuel were calculated as follows (in thousands, except APCD and costs per APCD): |
|||||||||||
|
Quarter Ended September 30, |
Nine Months Ended September 30, |
||||||||||
|
2023 |
2023 On a |
2019 |
2023 |
2023 On a |
2019 |
||||||
|
Total cruise operating |
$ 2,136,860 |
$ — |
$ 1,623,038 |
$ 5,884,641 |
$ — |
$ 4,581,246 |
|||||
|
Marketing, selling and |
393,016 |
— |
352,725 |
1,288,719 |
— |
1,144,546 |
|||||
|
Gross Cruise Costs |
2,529,876 |
2,533,970 |
1,975,763 |
7,173,360 |
7,198,339 |
5,725,792 |
|||||
|
Less: |
|||||||||||
|
Commissions, |
632,075 |
— |
488,921 |
1,551,012 |
— |
1,279,010 |
|||||
|
Onboard and other |
261,225 |
— |
200,656 |
640,175 |
— |
510,255 |
|||||
|
Net Cruise Costs Including |
1,636,576 |
— |
1,286,186 |
4,982,173 |
— |
3,936,527 |
|||||
|
Less: |
|||||||||||
|
Gain on sale of controlling |
— |
— |
— |
(3,130) |
— |
— |
|||||
|
Impairment and credit |
— |
— |
— |
(6,990) |
— |
— |
|||||
|
Restructuring charges and |
— |
— |
— |
5,288 |
— |
— |
|||||
|
Integration costs related to |
— |
— |
862 |
— |
— |
862 |
|||||
|
Transaction costs related to |
— |
— |
— |
— |
— |
1,186 |
|||||
|
Incidental costs related to |
— |
— |
(429) |
— |
— |
11,597 |
|||||
|
Net Cruise Costs |
1,636,576 |
1,639,511 |
1,285,753 |
4,987,005 |
5,002,889 |
3,922,882 |
|||||
|
Less: |
|||||||||||
|
Fuel (4) |
272,408 |
— |
178,373 |
849,839 |
— |
519,772 |
|||||
|
Net Cruise Costs Excluding |
$ 1,364,168 |
$ 1,367,103 |
$ 1,107,380 |
$ 4,137,166 |
$ 4,153,049 |
$ 3,403,110 |
|||||
|
APCD |
12,011,593 |
12,011,593 |
10,733,254 |
34,953,919 |
34,953,919 |
31,031,274 |
|||||
|
Gross Cruise Costs per |
$ 210.62 |
$ 210.96 |
$ 184.08 |
$ 205.22 |
$ 205.94 |
$ 184.52 |
|||||
|
Net Cruise Costs per APCD |
$ 136.25 |
$ 136.49 |
$ 119.79 |
$ 142.67 |
$ 143.13 |
$ 126.42 |
|||||
|
Net Cruise Costs Excluding |
$ 113.57 |
$ 113.82 |
$ 103.17 |
$ 118.36 |
$ 118.81 |
$ 109.67 |
|||||
|
(1) |
Represents gain on sale of controlling interest in cruise terminal facilities in Italy. These amounts are included in Other operating within our consolidated statements of comprehensive income (loss). |
|
(2) |
Represents asset impairments and credit losses recoveries for notes receivables for which credit losses were previously recorded. These amounts are included in Other operating within our consolidated statements of comprehensive income (loss). |
|
(3) |
These amounts are included in Marketing, selling and administrative expenses within our consolidated statements of comprehensive income (loss). |
|
(4) |
For the quarter and nine months ended September 30, 2019, the amount does not include fuel expenses, net of insurance recoveries, related to the collapse of the drydock structure at the Grand Bahama Shipyard involving Oasis of the Seas |
|
ROYAL CARIBBEAN CRUISES LTD. |
||||||||
|
NON-GAAP RECONCILING INFORMATION |
||||||||
|
(unaudited) |
||||||||
|
EBITDA and Adjusted EBITDA were calculated as follows (in thousands, except APCD and per APCD data): |
||||||||
|
Quarter Ended September 30, |
Nine Months Ended September 30, |
|||||||
|
2023 |
2022 |
2023 |
2022 |
|||||
|
Net Income (Loss) attributable to Royal Caribbean Cruises Ltd. |
$ 1,009,076 |
$ 32,968 |
$ 1,419,927 |
$ (1,655,756) |
||||
|
Interest income |
(7,472) |
(11,953) |
(31,863) |
(21,765) |
||||
|
Interest expense, net of interest capitalized |
340,620 |
352,187 |
1,055,519 |
932,552 |
||||
|
Depreciation and amortization expenses |
365,473 |
355,085 |
1,086,923 |
1,046,094 |
||||
|
Income tax expense (benefit) (1) |
6,876 |
(38) |
6,339 |
4,515 |
||||
|
EBITDA |
1,714,573 |
728,249 |
3,536,845 |
305,640 |
||||
|
Other expense (income) (2) |
1,029 |
(742) |
2,337 |
(9,214) |
||||
|
Gain on sale of controlling interest (3) |
— |
— |
(3,130) |
— |
||||
|
Impairment and credit losses (recoveries) (4) |
— |
10,186 |
(6,990) |
(584) |
||||
|
Restructuring charges and other initiative expenses |
— |
4,573 |
5,288 |
6,448 |
||||
|
Equity investment impairment and recovery of losses (5) |
12,634 |
— |
8,406 |
— |
||||
|
Adjusted EBITDA |
$ 1,728,236 |
$ 742,266 |
$ 3,542,756 |
$ 302,290 |
||||
|
APCD |
12,011,593 |
11,564,662 |
34,953,919 |
29,553,564 |
||||
|
Net Income (Loss) attributable to Royal Caribbean Cruises Ltd. |
$ 84.01 |
$ 2.85 |
$ 40.62 |
$ (56.03) |
||||
|
Adjusted EBITDA per APCD |
$ 143.88 |
$ 64.18 |
$ 101.36 |
$ 10.23 |
||||
|
(1) |
These amounts are included in Other (expense) income within our consolidated statements of comprehensive income (loss). |
|
(2) |
Represents net non-operating income or expense. For the periods reported, primarily relates to gains or losses arising from the remeasurement of monetary assets and liabilities denominated in foreign currencies. The amount excludes income tax expense (benefit), included in the EBITDA calculation above. |
|
(3) |
Represents gain on sale of controlling interest in cruise terminal facilities in Italy. These amounts are included in Other operating within our consolidated statements of comprehensive income (loss). |
|
(4) |
Represents asset impairments and credit loss recoveries for notes receivables for which credit losses were previously recorded. These amounts are included in Other operating within our consolidated statements of comprehensive income (loss). |
|
(5) |
For the quarter and nine months ended September 30, 2023, represents equity method impairments of $12.6 million. Additionally, the nine months ended September 30, 2023, includes a $4.2 million recovery of losses from one of our equity method investees recognized during the second quarter of 2023. These amounts are included in Equity investment income within our consolidated statements of comprehensive income (loss). |
|
ROYAL CARIBBEAN CRUISES LTD. |
|
|
NON-GAAP RECONCILING INFORMATION |
|
|
(unaudited) |
|
|
EBITDA and Adjusted EBITDA were calculated as follows (in thousands, except APCD and per APCD data): |
|
|
Year Ended December 31, |
|
|
2019 |
|
|
Net Income attributable to Royal Caribbean Cruises Ltd. |
$ 1,878,887 |
|
Interest income |
(26,945) |
|
Interest expense, net of interest capitalized |
408,513 |
|
Depreciation and amortization expenses |
1,245,942 |
|
Income tax expense (1) |
32,602 |
|
EBITDA |
3,538,999 |
|
Other income (2) |
(8,089) |
|
Restructuring charges and other initiatives expenses |
13,707 |
|
Oasis of the Seas incident, Grand Bahama's Drydock write-off and other incidental expense (3) |
35,239 |
|
Transaction and integration cost related to the 2018 Silversea acquisition |
2,048 |
|
Non-controlling interest adjustment (4) |
35,965 |
|
Adjusted EBITDA |
$ 3,617,869 |
|
APCD |
41,432,451 |
|
Net Income attributable to Royal Caribbean Cruises Ltd. per APCD |
$ 45.35 |
|
Adjusted EBITDA per APCD |
$ 87.32 |
|
(1) |
Included within Other income (expense) in our consolidated statements of comprehensive income (loss). |
|
(2) |
Excludes income tax expense, included in the EBITDA calculation above. |
|
(3) |
Amount includes incidental costs, net of insurance recoveries of $14.5 million related to the collapse of the drydock structure at the Grand Bahama Shipyard involving Oasis of the Seas, which were reported primarily within Other operating expenses in our consolidated statements of comprehensive income (loss) for the year ended December 31, 2019; and $20.7 million regarding the Grand Bahama incident involving one of its drydocks, included in our Equity investment income within our consolidated statements of comprehensive income (loss) for the year ended December 31, 2019. |
|
(4) |
Adjustment made to exclude the impact of the contractual accretion requirements associated with the put option held by Heritage Cruise Holding Ltd.'s (previously known as Silversea Cruises Group Ltd.) noncontrolling interest, which noncontrolling interest we acquired on July 9, 2020. |
|
ROYAL CARIBBEAN CRUISES LTD. |
|||||||
|
NON-GAAP RECONCILING INFORMATION |
|||||||
|
(unaudited) |
|||||||
|
Adjusted Net Income (Loss) attributable to Royal Caribbean Cruises Ltd. and Adjusted Earnings (Loss) per Share were calculated as follows (in thousands, except shares and per share data): |
|||||||
|
Quarter Ended September 30, |
Nine Months Ended September 30, |
||||||
|
2023 |
2022 |
2023 |
2022 |
||||
|
Net Income (Loss) attributable to Royal Caribbean Cruises Ltd. |
$ 1,009,076 |
$ 32,968 |
$ 1,419,927 |
$ (1,655,756) |
|||
|
Loss on extinguishment of debt |
37,923 |
16,449 |
81,441 |
16,449 |
|||
|
Gain on sale of controlling interest (1) |
— |
— |
(3,130) |
— |
|||
|
PortMiami tax on sale of noncontrolling interest (2) |
— |
— |
10,020 |
— |
|||
|
Silver Whisper deferred tax liability release (3) |
— |
— |
(25,784) |
— |
|||
|
Impairment and credit losses (recoveries) (4) |
— |
10,186 |
(6,990) |
(584) |
|||
|
Amortization of Silversea Cruises intangible assets resulting from the Silversea |
1,623 |
1,623 |
4,869 |
4,870 |
|||
|
Restructuring charges and other initiative expenses |
— |
4,573 |
5,288 |
6,448 |
|||
|
Equity investments impairment and recovery of losses (6) |
16,672 |
— |
12,444 |
— |
|||
|
Adjusted Net Income (Loss) attributable to Royal Caribbean Cruises Ltd. |
$ 1,065,294 |
$ 65,799 |
$ 1,498,085 |
$ (1,628,573) |
|||
|
Earnings (Loss) per Share - Diluted (7) |
$ 3.65 |
$ 0.13 |
$ 5.24 |
$ (6.49) |
|||
|
Adjusted Earnings (Loss) per Share - Diluted (7) |
$ 3.85 |
$ 0.26 |
$ 5.52 |
$ (6.39) |
|||
|
Weighted-Average Shares Outstanding - Diluted |
281,876 |
255,378 |
283,847 |
254,953 |
|||
|
(1) |
Represents gain on sale of controlling interest in cruise terminal facilities in Italy. These amounts are included in Other operating within our consolidated statements of comprehensive income (loss). |
|
(2) |
Represents tax on the PortMiami sale of noncontrolling interest. These amounts are included in Other (expense) income in our consolidated statements of comprehensive income (loss). |
|
(3) |
Represents the release of the deferred tax liability subsequent to the execution of the bargain purchase option for the Silver Whisper. These amounts are included in Other (expense) income within our consolidated statements of comprehensive income (loss). |
|
(4) |
Represents asset impairments and credit loss recoveries for notes receivables for which credit losses were previously recorded. These amounts are included in Other operating within our consolidated statements of comprehensive income (loss). |
|
(5) |
Represents the amortization of the Silversea Cruises intangible assets resulting from the 2018 Silversea Cruises acquisition. |
|
(6) |
For the quarter and nine months ended September 30, 2023, represents equity method impairments of $12.6 million and recognition of deferred currency translation adjustment losses of $4.0 million. These amounts are included in Equity investment income and Other (expense) income within our consolidated statements of comprehensive income (loss), respectively. Additionally, the nine months ended September 30, 2023, includes a $4.2 million recovery of losses from one of our equity method investees recognized during the second quarter of 2023. This amount is included in Equity investment income within our consolidated statements of comprehensive income (loss). |
|
(7) |
Diluted EPS and Adjusted Diluted EPS includes the add-back of dilutive interest expense related to our convertible notes of $20.3 million and $67.6 million for the quarter and nine months ended September 30, 2023, respectively. |